
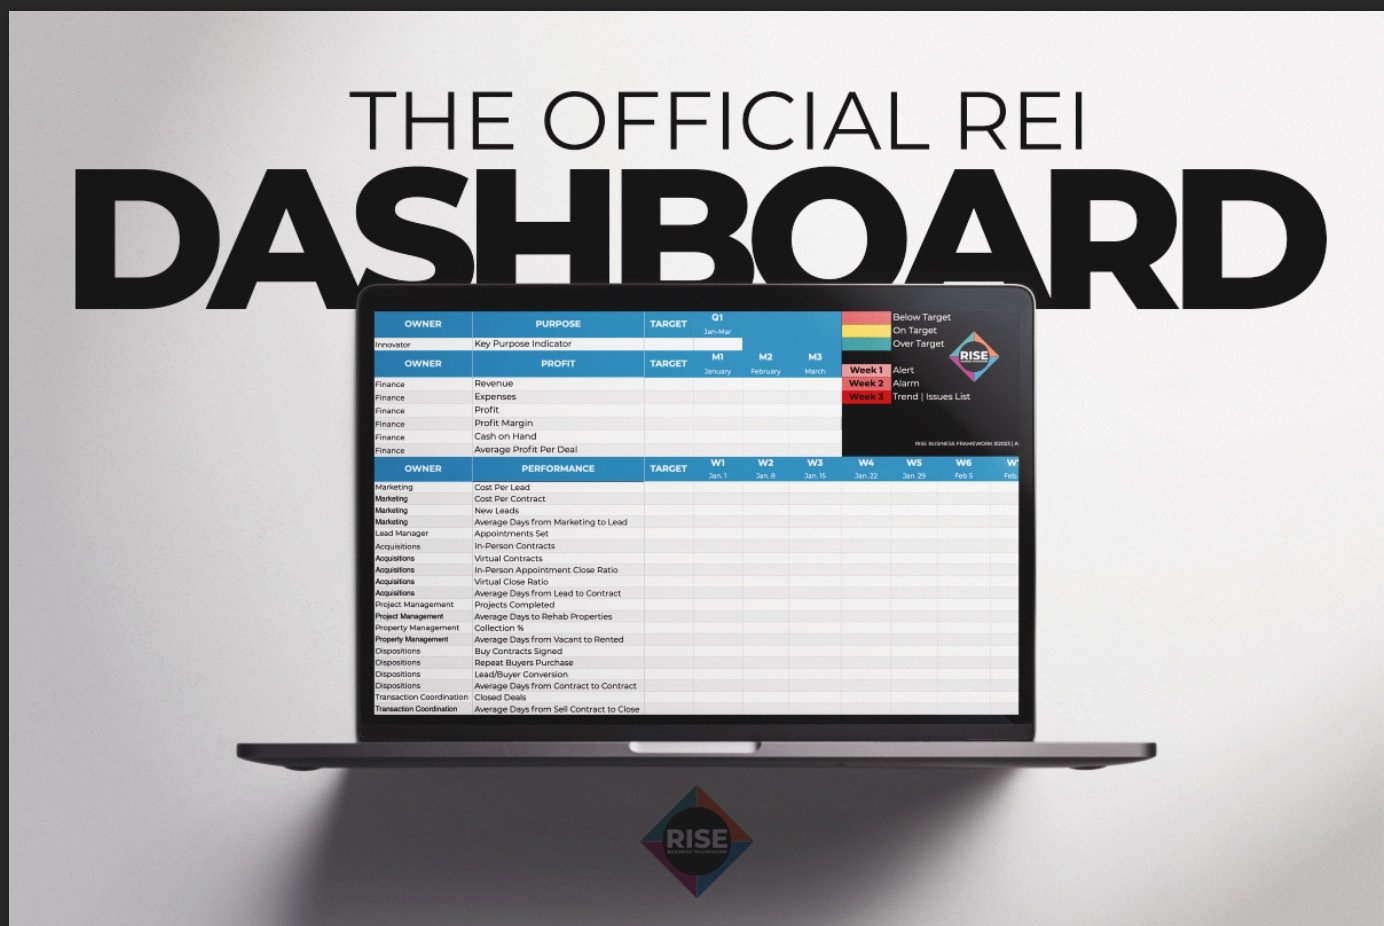
The Official REI Dashboard
Your All-in-One Stoplight Report
Track, Measure, and Optimize Your Real Estate Investing Performance.
Trusted by top real estate investors & business owners
Why You Need The Official REI Dashboard
Stoplight Performance Tracking – See instantly where your business is excelling or struggling.
Key Purpose & Profit Indicators - Understand what drives your revenue and growth.excelling or struggling.
Streamlined Decision Making – Make data-backed decisions with real-time insights.
Simple & Effective – Plug in your numbers and get instant clarity.
Simple 3 Step Process

Upload Data

View Insights

Take Action
Get Instant Access to The Official REI Dashboard
Frequently Asked Questions
Question 1: What is The Official REI Dashboard?
The Official REI Dashboard is a real estate investing performance tracker that uses a Stoplight Report system (Red, Yellow, Green indicators) to provide instant insights into your business health. It helps you measure key performance metrics, identify weak spots, and optimize your strategies for maximum profitability.
Question 2: How does the Stoplight Report work?
The Stoplight Report categorizes your business metrics into three easy-to-understand colors:
Green 🟢 – Everything is on track and performing well.
Yellow 🟡 – Some areas need attention, but they are manageable.
Red 🔴 – Critical issues require immediate action.
This simple visual system allows you to quickly assess your business health and make data-driven decisions.
Question 3: Who is this dashboard for?
The dashboard is designed for real estate investors, business owners, and entrepreneurs looking to track performance, improve efficiency, and scale their businesses. Whether you're a fix-and-flip investor, rental property owner, wholesaler, or property manager, this tool will help you make informed decisions and drive success.
Question 4: Can I customize it?
Yes! The Official REI Dashboard is fully customizable. You can adjust the key metrics, add your own data points, and tailor it to fit your specific business needs. Whether you’re tracking lead conversions, deal flow, revenue, or expenses, you can modify the dashboard to align with your goals.

FOLLOW US
COMPANY
PRODUCTS
LEGAL
INTEGRITY
BELIEF
GIVING
HARD WORK
Copyright 2025. Sharper Business Solutions. All Rights Reserved.